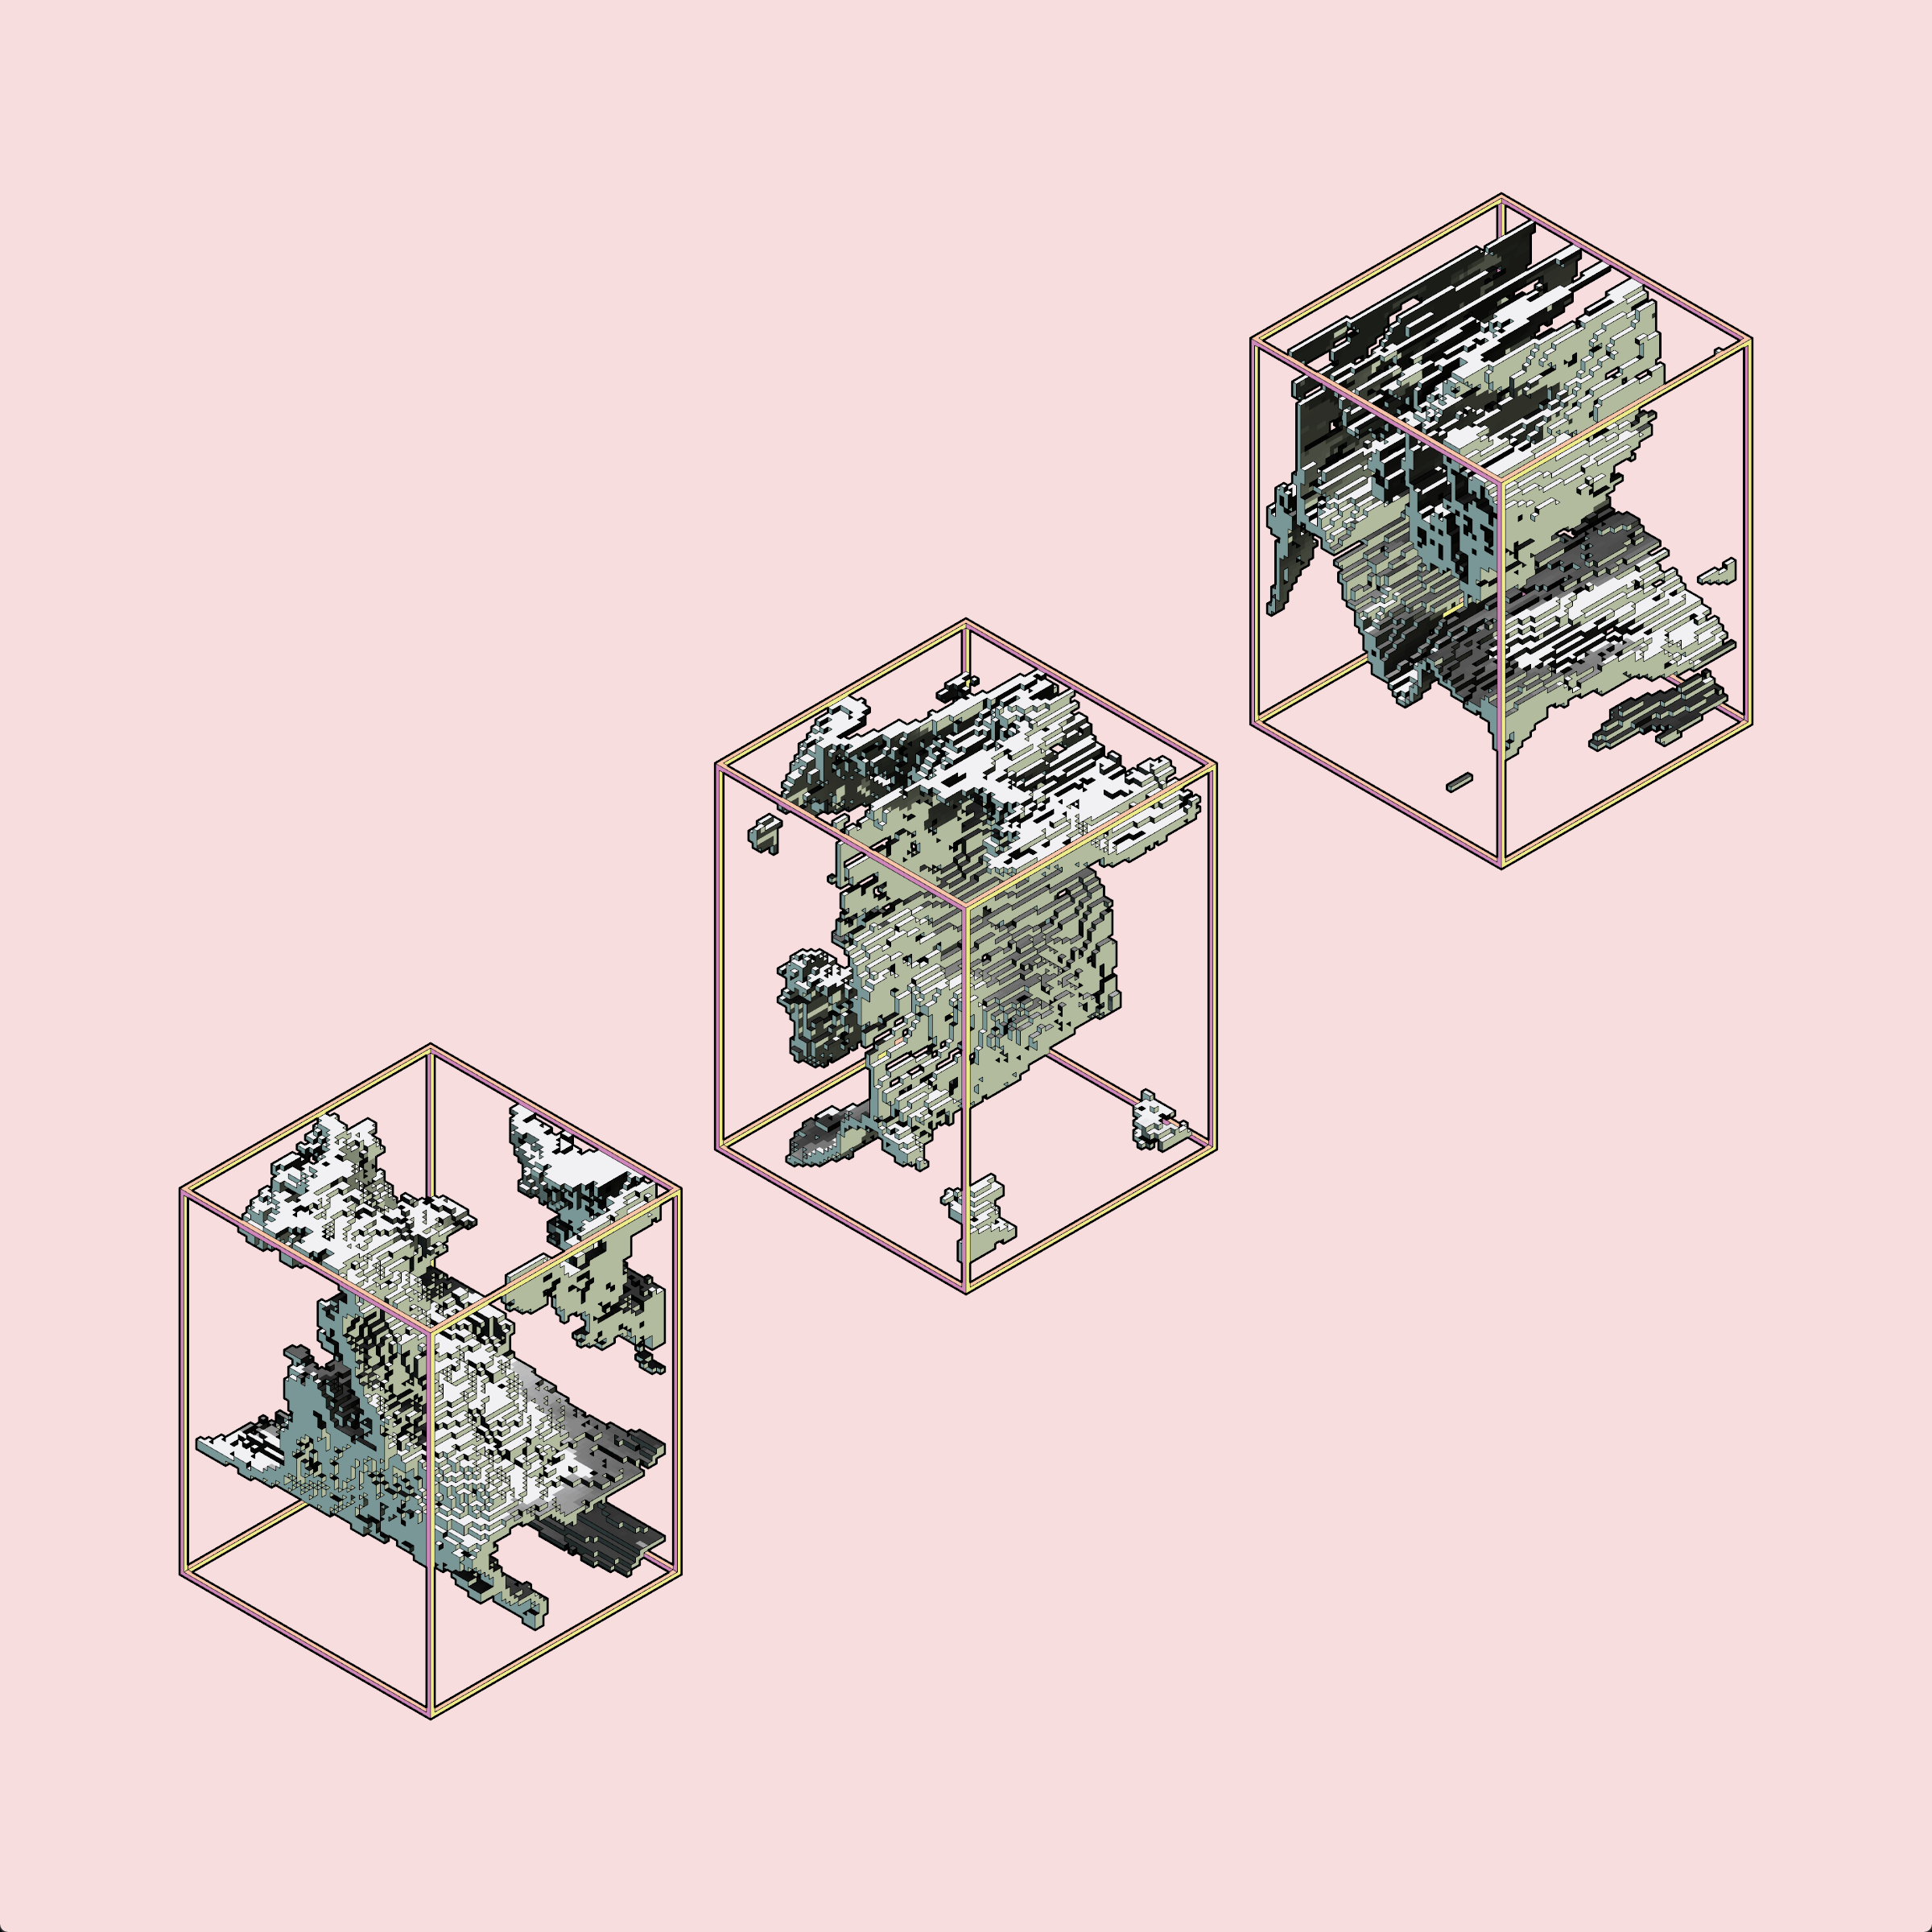
Part of the raw data-visualizations made for a video artwork Sievert Rising by Frederik De Wilde to accompany his Lead Angels installation. Created with Processing 2.2.1. No post-processing.
22.8M measurement points collected by the Safecast community:http://blog.safecast.org/
Topographical data processed from the DEM3 data at http://www.viewfinderpanoramas.org/dem3.html
Highly/excessively detailed coastline shapefile from http://www.mapcruzin.com/
Frederik De Wilde talks about his artwork Sievert Rising here.